Our Essential Standards call for us to learn about the first people who lived in North Carolina as we travel through our state's history.
While I chose to go to the traditional "break the kiddos into groups to research a tribe and report their findings" tasks, I did go for a new take on how they reported their findings. We also took it a bit further as we compared and contrasted the tribes.
For our research template, I created a Google Doc. It wasn't anything fancy, but it did the job. If you'd like a copy, click here. Typically, I find all the websites ahead of time and have everything set up so that all they have to do is click and record their findings. Not this time. Our kiddos are more than capable of finding information. I wanted them to find and evaluate their research sources. And so, they did. Some of them really struggled with finding EXACTLY what they were looking for. Don't we all? It was great to see/help them puzzle through their problems to get where they needed to be.
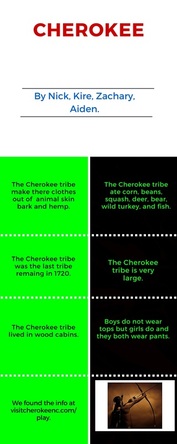
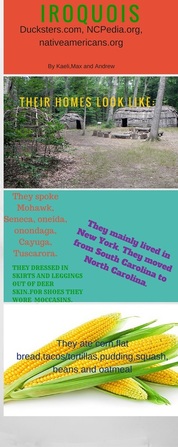
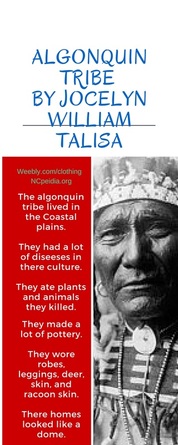
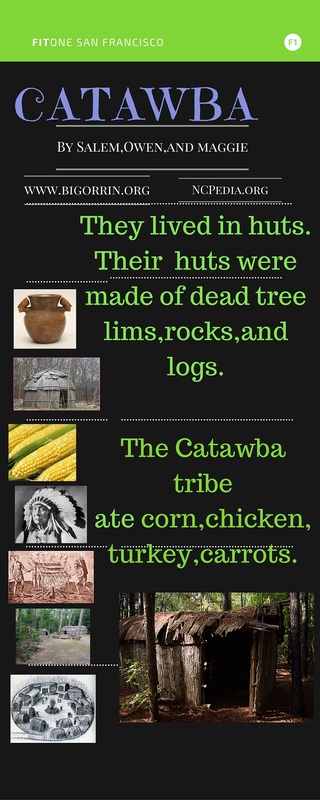
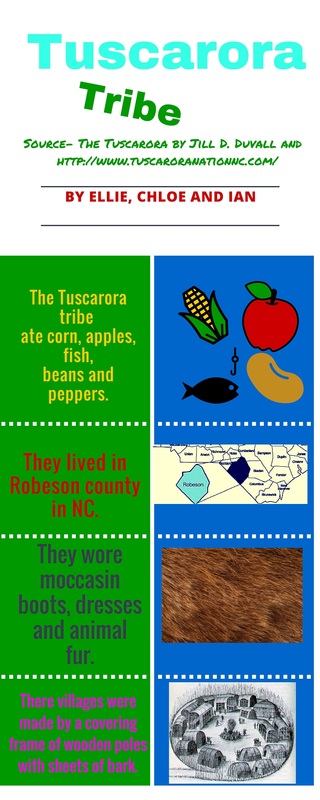
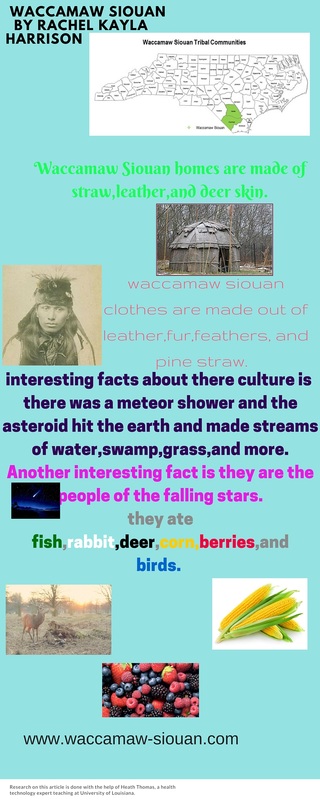
To share their findings, they used Canva to create an infographic for each tribe. It's a really simple (and mostly free) graphic design program. If you haven't used it before, you're able to create all sorts of images using your own resources or a stock of free (and paid) elements. I've used it for so many things. I love it! Since we had already discussed creating resources with our audience in mind when they completed their state symbols project, it was exciting to hear them discuss their design choices and evaluate the best ways to get their information and messages across.
Each infographic was totally unique! I love how they turned out!
While I chose to go to the traditional "break the kiddos into groups to research a tribe and report their findings" tasks, I did go for a new take on how they reported their findings. We also took it a bit further as we compared and contrasted the tribes.
For our research template, I created a Google Doc. It wasn't anything fancy, but it did the job. If you'd like a copy, click here. Typically, I find all the websites ahead of time and have everything set up so that all they have to do is click and record their findings. Not this time. Our kiddos are more than capable of finding information. I wanted them to find and evaluate their research sources. And so, they did. Some of them really struggled with finding EXACTLY what they were looking for. Don't we all? It was great to see/help them puzzle through their problems to get where they needed to be.
To share their findings, they used Canva to create an infographic for each tribe. It's a really simple (and mostly free) graphic design program. If you haven't used it before, you're able to create all sorts of images using your own resources or a stock of free (and paid) elements. I've used it for so many things. I love it! Since we had already discussed creating resources with our audience in mind when they completed their state symbols project, it was exciting to hear them discuss their design choices and evaluate the best ways to get their information and messages across.
Each infographic was totally unique! I love how they turned out!
 |  |  |
 |  |  |
While each group was presenting their infographic to the class, the other groups were scoring their infographic and information using a checklist that they had created themselves. Again, I usually put together the rubric, but this time I thought that since they were the experts in creating the products that they should be the ones to decide how it should be scored. The students came up with some non-negotiables after having a bit of time to work on their graphics. Some of their criteria: correct capitals and punctuation, at least one fact from each category on the research template, and at least one picture/photograph. Listening to them discuss and debate while looking over their peers' work while comparing it to their own work was amazing. I also scored each group using the same rubric and gave them a score for the completion of the research template.
Once all of the presentations were over, we used the information to compare and contrast the tribes and to make some generalizations about life for the first people who lived on the land that is now our state. The students then spent a bit of time independently reflecting on and thinking about their learning using this template. The reflection template also included a couple of questions to get them thinking about our next topic--Europeans arriving and settling on the land.
The final piece was printing out each infographic and adding it to our giant map of North Carolina. This map sits out in the hallway and is the keeper of all of our social studies learning this year. It serves as reminder of what we've learned and shows our progress (personally and through the curriculum) throughout the year. So far, it showcases these infographics and QR codes that describe the geographic regions of our state. I love it and can't wait to add more!
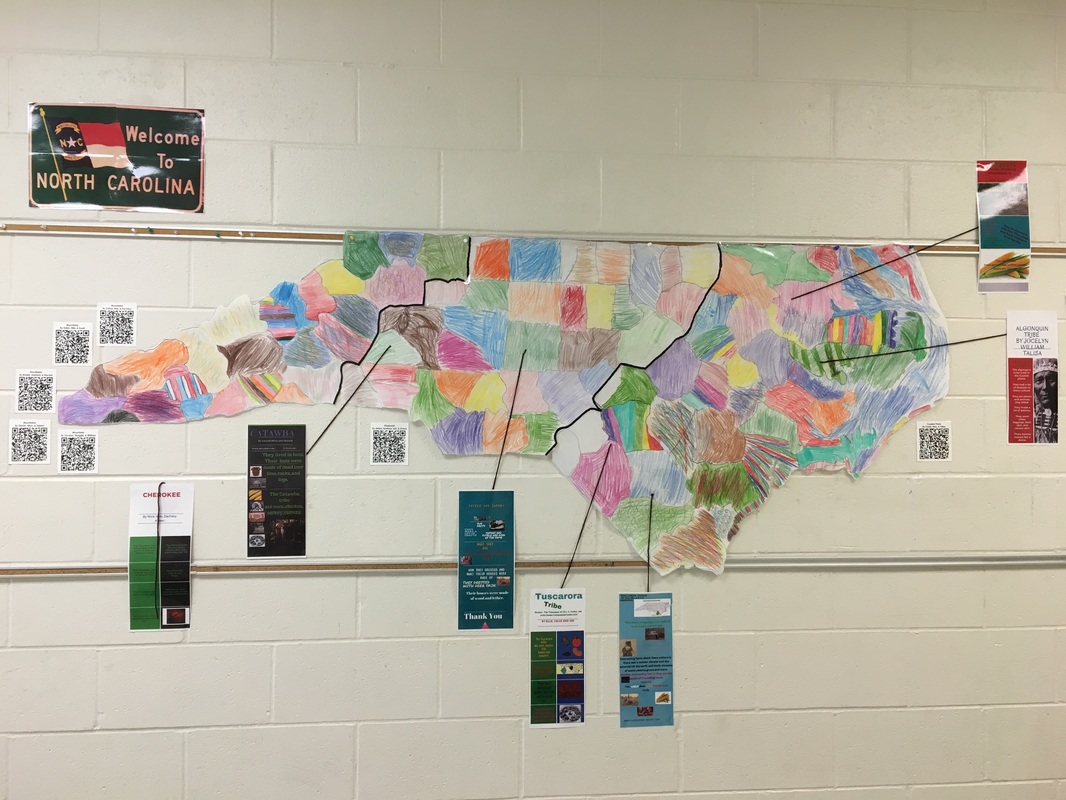
(I noticed after taking this photo that one of our "lines" needs fixing. Oh well... Progress over perfection, right? I'll fix it. I'm also thinking of adding a timeline to the bottom, but haven't gotten there yet.)
This was a lot of fun, and I think an engaging way for the students to show their learning. We'll be using Canva again for another project soon. As for our next social studies topic, we've got something REALLY fun planned... Stay tuned!
This was a lot of fun, and I think an engaging way for the students to show their learning. We'll be using Canva again for another project soon. As for our next social studies topic, we've got something REALLY fun planned... Stay tuned!
 RSS Feed